
ACT Science Practice Test 24
Bộ sưu tập: Tuyển Tập Bộ Đề Thi Đại Học Hoa Kỳ (ACT) - Có Đáp Án Chi Tiết
Số câu hỏi: 20 câuSố mã đề: 1 đềThời gian: 1 giờ
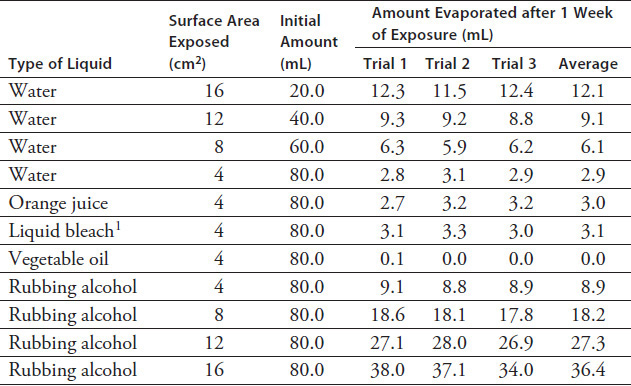
A study was conducted to identify the factors that affect the evaporation rates of various liquids in air. Throughout the experiment, the amount of liquid was varied, and the surface area exposed to the air was also manipulated. Table 8.3 displays the results.
TABLE 8.3
1The liquid bleach was approximately 5% sodium hypochlorite and 95% water
The experiment was continued over a period of seven weeks for water and alcohol. Figure 8.5 shows the results graphically.
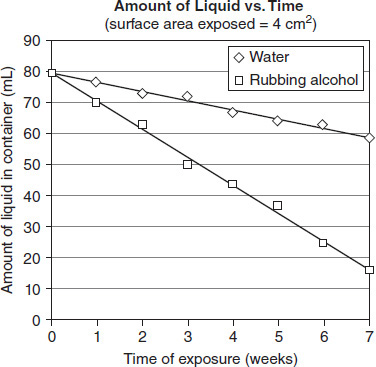
Figure 8.5
Based on the data for water in Table 8.3, which of the following statements do the data NOT support?
The trials with larger surface areas of exposed water had greater evaporation rates.
The evaporation rate for water is less than that for rubbing alcohol.
Water had approximately the same evaporation rate as orange juice.
Larger amounts of water correlate to higher evaporation rates.
In the experiment, 80 mL of orange juice with 4 cm2 exposed was left in the open for one week. Using the data in Table 8.3, how much of the original liquid was left at the end of the week?
3.0 mL
77.0 mL
80.0 mL
83.0 mL
Before the experiment, students made the following hypotheses:
Student 1: "Since I can smell rubbing alcohol as soon as I open the bottle, I expect it to have a greater rate of evaporation in air."
Student 2: "Since orange juice and liquid bleach are composed primarily of water, their evaporation rates will be close to that of water."
Student 3: "Surface area should not affect the rate of evaporation of a liquid because only the total amount of liquid affects evaporation rates."
Which of the hypotheses are supported by the data collected?
Student 1 only
Students 1 and 2
Students 1, 2, and 3
None of the students' hypotheses are supported by the data.
If 80.0 mL of rubbing alcohol are placed in a container with 20 cm2 exposed, what would be the approximate amount of liquid left in the container after one week?
9 mL
15 mL
35 mL
45 mL
Using Figure 8.5, what is the approximate number of weeks required for 80 mL of rubbing alcohol to evaporate completely from a container with a 4 cm2 exposure?
9 weeks
12 weeks
28 weeks
The data does not provide enough evidence to make a reasonable prediction.
According to Figure 8.5, what is the rate of evaporation of water with a 4 cm2 exposed surface area?
3 mL of water each week
10 mL of water each week
20 mL of water each week
80 mL of water each week
Which of the following conclusions may be supported by Figure 8.5?
The rate of evaporation for alcohol increases with time.
The rate of evaporation for alcohol decreases with time.
The rate of evaporation for alcohol is fairly steady with time.
The rate of evaporation for water is greater than that for alcohol.
If data for vegetable oil were added to Figure 8.5, one would most likely see:
data with a steeper negative slope than that of rubbing alcohol.
data very similar to the line for water.
data with a flat line.
data very similar to the line for rubbing alcohol.
Which of the following statements about rubbing alcohol is supported by the data?
The variability between the trials increases with the surface area exposed.
A decrease in surface area of exposure increases the evaporation rate.
An increased amount of liquid in the container increases the evaporation rate.
The rate of evaporation for rubbing alcohol is greater than that for ethyl alcohol.
Although the graph for rubbing alcohol displays a general downward trend, the variations in the data could possibly be attributed to all of the following EXCEPT:
fluctuations in temperature in the room in which the containers were located.
variations in the air flow in the room in which the containers were located.
inaccuracies in the measurement of liquid volume.
varying amounts of initial liquid in the containers.
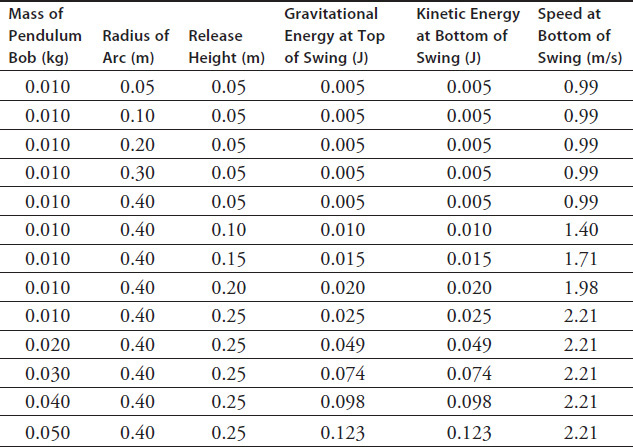
A simple pendulum consists of a mass (the pendulum bob) suspended by a string, as shown in Figure 8.6. In an experiment, the mass of the bob, the radius of the arc, and the release height (measured vertically from the bottom of the swing) were varied. Rather than measuring the speed at the bottom of the swing, energy analysis was used to predict the speed of the pendulum bob at the bottom of the swing. The results are shown in Table 8.4.
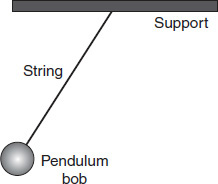
Figure 8.6
TABLE 8.4
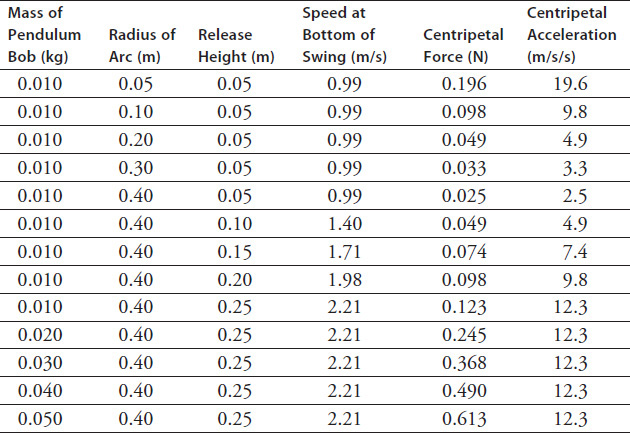
A second experiment used the same scenario, but it included the measurement of the centripetal force and calculation of centripetal acceleration. Centripetal force is a real, unbalanced force pointed toward the center of an object's circular motion. Likewise, centripetal acceleration is defined as the component of acceleration directed toward the center. As a pendulum bob swings through the bottom of its arc, the string force dominates the gravitational force, thus providing the centripetal force that gives the pendulum bob its upward centripetal acceleration. The results are shown in Table 8.5.
TABLE 8.5
According to the data in Table 8.4, increasing the mass of the pendulum bob:
has no effect on the gravitational energy at the top of the swing.
decreases the gravitational energy at the top of the swing.
increases the radius of the arc.
has no effect on the speed at the bottom of the swing.
A 0.010-kg pendulum has an arc radius of 0.40 m. Using the data trends shown in Table 8.4, predict the kinetic energy at the bottom of the swing if it is released from a height of 0.35 m.
0.025 J
0.030 J
0.035 J
0.040 J
According to Table 8.4, when the release height doubles, the gravitational energy at the top of the swing:
doubles.
quadruples.
decreases to one-half its value.
decreases to one-fourth its value.
Which of the following conclusions about energy is supported by Table 8.4?
Kinetic energy at the bottom of the swing is directly proportional to speed.
Gravitational energy at the top of the swing is inversely proportional to release height.
Kinetic energy at the bottom of the swing is directly proportional to the radius of the arc.
Gravitational energy at the top of the swing equals kinetic energy at the bottom of the swing.
When the mass of the pendulum bob doubles, the kinetic energy at the bottom of the swing:
doubles.
quadruples.
decreases to one-half its value.
decreases to one-fourth its value.
When the pendulum bob's kinetic energy doubles, its speed:
doubles.
decreases to one-half its value.
increases by a factor of 1.4.
increases by a factor of 2.2.
According to Table 8.5, centripetal acceleration is
independent of mass.
directly proportional to mass.
inversely proportional to mass.
directly proportional to the radius of the arc.
When the radius of the arc doubles, the centripetal force:
doubles.
quadruples.
decreases to one-half its value.
decreases to one-fourth its value.
A car approaches a school zone with a speed limit of 20 miles per hour. Using the data trends shown in Table 8.4, how does the kinetic energy of a car speeding at 40 miles per hour compare to that of a car moving at the speed limit?
The speeding car's kinetic energy is one-half that of the other car.
The speeding car's kinetic energy is one-fourth that of the other car.
The speeding car's kinetic energy is twice that of the other car.
The speeding car's kinetic energy is four times that of the other car.
Using Table 8.5, predict the centripetal force on a 0.060-kg bob with a 0.40-m arc radius that is released from a height of 0.25 m.
0.613 N
0.736 N
1.226 N
9.800 N