New SAT Reading Practice Test 30
Bộ sưu tập: SAT Practice Test
Số câu hỏi: 11 câuSố mã đề: 1 đềThời gian: 1 giờ
This passage is adapted from Alan Ehrenhalt, The Great Inversion and the Future of the American City. ©2013 by Vintage. Ehrenhalt is an urbanologist—a scholar of cities and their development. Demographic inversion is a phenomenon that describes the rearrangement of living patterns throughout a metropolitan area.
We are not witnessing the abandonment of the
suburbs, or a movement of millions of people back to
the city all at once. The 2010 census certainly did not
turn up evidence of a middle-class stampede to the
5 nation’s cities. The news was mixed: Some of the
larger cities on the East Coast tended to gain
population, albeit in small increments. Those in the
Midwest, including Chicago, tended to lose
substantial numbers. The cities that showed gains in
10 overall population during the entire decade tended to
be in the South and Southwest. But when it comes to
measuring demographic inversion, raw census
numbers are an ineffective blunt instrument. A closer
look at the results shows that the most powerful
15 demographic events of the past decade were the
movement of African Americans out of central cities
(180,000 of them in Chicago alone) and the
settlement of immigrant groups in suburbs, often
ones many miles distant from downtown.
20 Central-city areas that gained affluent residents in
the first part of the decade maintained that
population in the recession years from 2007 to 2009.
They also, according to a 2011 study by Brookings,
suffered considerably less from increased
25 unemployment than the suburbs did. Not many
young professionals moved to new downtown
condos in the recession years because few such
residences were being built. But there is no reason to
believe that the demographic trends prevailing prior
30 to the construction bust will not resume once that
bust is over. It is important to remember that
demographic inversion is not a proxy for population
growth; it can occur in cities that are growing, those
whose numbers are flat, and even in those
35 undergoing a modest decline in size.
America’s major cities face enormous fiscal
problems, many of them the result of public pension
obligations they incurred in the more prosperous
years of the past two decades. Some, Chicago
40 prominent among them, simply are not producing
enough revenue to support the level of public
services to which most of the citizens have grown to
feel entitled. How the cities are going to solve this
problem, I do not know. What I do know is that if
45 fiscal crisis were going to drive affluent professionals
out of central cities, it would have done so by now.
There is no evidence that it has.
The truth is that we are living at a moment in
which the massive outward migration of the affluent
50 that characterized the second half of the
twentieth century is coming to an end. And we need
to adjust our perceptions of cities, suburbs, and
urban mobility as a result.
Much of our perspective on the process of
55 metropolitan settlement dates, whether we realize it
or not, from a paper written in 1925 by the
University of Chicago sociologist Ernest W. Burgess.
It was Burgess who defined four urban/suburban
zones of settlement: a central business district; an
60 area of manufacturing just beyond it; then a
residential area inhabited by the industrial and
immigrant working class; and finally an outer
enclave of single-family dwellings.
Burgess was right about the urban America of
65 1925; he was right about the urban America of 1974.
Virtually every city in the country had a downtown,
where the commercial life of the metropolis was
conducted; it had a factory district just beyond; it had
districts of working-class residences just beyond that;
70 and it had residential suburbs for the wealthy and the
upper middle class at the far end of the continuum.
As a family moved up the economic ladder, it also
moved outward from crowded working-class
districts to more spacious apartments and,
75 eventually, to a suburban home. The suburbs of
Burgess’s time bore little resemblance to those at the
end of the twentieth century, but the theory still
essentially worked. People moved ahead in life by
moving farther out.
80 But in the past decade, in quite a few places, this
model has ceased to describe reality. There are still
downtown commercial districts, but there are no
factory districts lying next to them. There are
scarcely any factories at all. These close-in parts of
85 the city, whose few residents Burgess described as
dwelling in “submerged regions of poverty,
degradation and disease,” are increasingly the
preserve of the affluent who work in the commercial
core. And just as crucially newcomers to America are
90 not settling on the inside and accumulating the
resources to move out; they are living in the suburbs
from day one.
Which choice best summarizes the first paragraph of the passage (lines 1-35)?
The 2010 census demonstrated a sizeable growth in the number of middle-class families moving into inner cities.
The 2010 census is not a reliable instrument for measuring population trends in American cities.
Population growth and demographic inversion are distinct phenomena, and demographic inversion is evident in many American cities.
Population growth in American cities has been increasing since roughly 2000, while suburban populations have decreased.
According to the passage, members of which group moved away from central-city areas in large numbers in the early 2000s?
The unemployed
Immigrants
Young professionals
African Americans
In line 34, “flat” is closest in meaning to
static.
deflated.
featureless.
obscure.
According to the passage, which choice best describes the current financial situation in many major American cities?
Expected tax increases due to demand for public works
Economic hardship due to promises made in past years
Greater overall prosperity due to an increased inner-city tax base
Insufficient revenues due to a decrease in manufacturing
Which choice provides the best evidence for the answer to the previous question?
Lines 36-39 (“America’s... decades”)
Lines 43-44 (“How . . . not know”)
Lines 44-46 (“What... now”)
Lines 48-51 (“The truth... end”)
The passage implies that American cities in 1974
were witnessing the flight of minority populations to the suburbs.
had begun to lose their manufacturing sectors.
had a traditional four-zone structure.
were already experiencing demographic inversion.
Which choice provides the best evidence for the answer to the previous question?
Lines 54-57 (“Much... Ernest W. Burgess”)
Lines 58-59 (“It was... settlement”)
Lines 66-71 (“Virtually... continuum”)
Lines 72-75 (“As... home”)
As used in line 68, “conducted” is closest in meaning to
carried out.
supervised.
regulated.
inhibited.
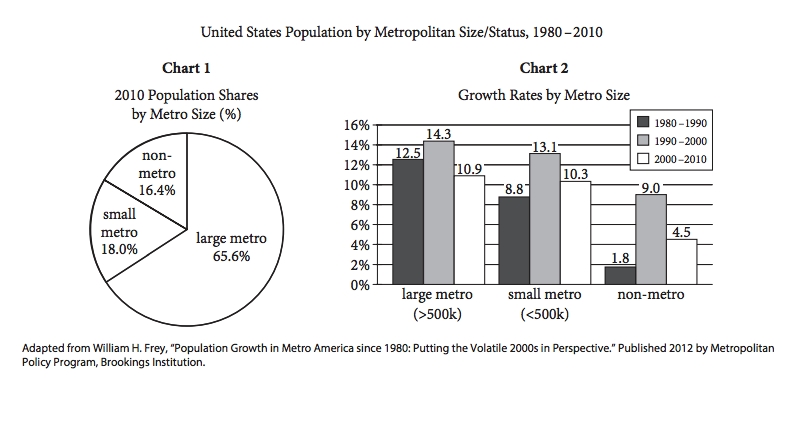
The author of the passage would most likely consider the information in chart 1 to be
excellent evidence for the arguments made in the passage.
possibly accurate but too crude to be truly informative.
compelling but lacking in historical information.
representative of a perspective with which the author disagrees.
According to chart 2, the years 2000–2010 were characterized by
less growth in metropolitan areas of all sizes than had taken place in the 1990s.
more growth in small metropolitan areas than in large metropolitan areas.
a significant decline in the population of small metropolitan areas compared to the 1980s.
roughly equal growth in large metropolitan areas and nonmetropolitan areas.
Chart 2 suggests which of the following about population change in the 1990s?
Large numbers of people moved from suburban areas to urban areas in the 1990s.
Growth rates fell in smaller metropolitan areas in the 1990s.
Large numbers of people moved from metropolitan areas to nonmetropolitan areas in the 1990s.
The US population as a whole grew more in the 1990s than in the 1980s.
1.486 xem
1 mã đề 1 câu hỏi
1 mã đề 1 câu hỏi
1 mã đề 1 câu hỏi
1 mã đề 10 câu hỏi
1 mã đề 11 câu hỏi