ACT Science Practice Test 19
Bộ sưu tập: Tuyển Tập Bộ Đề Thi Đại Học Hoa Kỳ (ACT) - Có Đáp Án Chi Tiết
Số câu hỏi: 29 câuSố mã đề: 1 đềThời gian: 1 giờ
A rollercoaster car is often used as a model of energy transformations. Resting at its starting point, the car has gravitational potential energy. As it moves along the track, the potential energy is converted to kinetic energy and then back to potential energy as the car approaches the rollercoaster's ending point.
An object's gravitational potential energy can be calculated as the product of the object's mass, acceleration due to gravity, and the object's height above the ground (PEg = m × g × h). In a frictionless system, the amount of potential energy at the beginning and end of the rollercoaster would be equal. However, friction between the car and the track causes frictional dissipation to transform some of the energy to heat and sound. The amount of energy dissipated due to friction can be calculated as the product of the frictional force on an object and the distance traveled by the object (Ffd).
A group of students built a marble rollercoaster out of foam pipe insulation tubing and tried to determine the conditions that would maximize the height of the rollercoaster's hill. The students conducted two experiments to study the effects of gravitational potential energy and frictional dissipation on the marble.
Experiment 1
Figure 5.1 shows the initial setup for the marble rollercoaster. A indicates the starting height (drop height) and C indicates the ending height (hill height) of the marble. B is the lowest point located halfway between A and C.
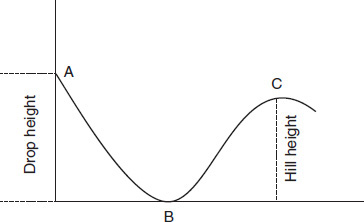
Figure 5.1
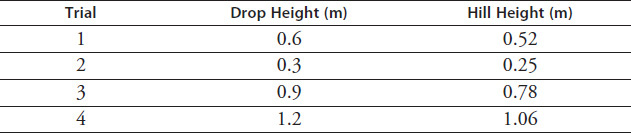
Students started with a drop height of 0.6 m and stretched the rollercoaster tubing out to a horizontal length of 1 m. They then varied the hill height until the marble was able to successfully reach the top of the hill without going over. To study the effects of the marble's initial gravitational potential energy, students conducted three more trials using different drop heights. Table 5.3 shows the results for each trial.
TABLE 5.3 Experiment 1
Experiment 2
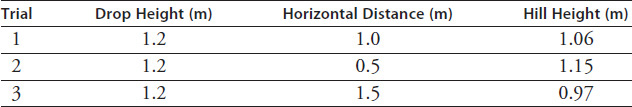
Students started with a drop height of 1.2 m and stretched the rollercoaster tubing out to a horizontal length of 1.0 m. Students then varied the hill height until the marble was able to reach the top of the hill successfully without going over. To study the effects of frictional dissipation, students conducted two more trials using different horizontal track lengths. Table 5.4 shows the results for each trial.
TABLE 5.4 Experiment 2
When determining the gravitational potential energy of various objects on Earth, which variable would be considered a constant?
h
m
PEg
g
According to the formula provided in the passage, doubling the height of an object should:
double that object's potential energy.
half that object's mass.
double that object's mass.
halve that object's potential energy.
In a frictionless environment, with a drop height of A1 the marble should be able to reach a hill height (C in Figure 5.1) of:
1.0 m.
0.6 m.
1.2 m.
0.5 m.
In Experiment 1, students altered the drop height of the marble to test the effect of which of the following variables on hill height?
Frictional dissipation
Horizontal distance traveled
Initial gravitational potential energy
Mass of the marble
What was the maximum drop height used in either experiment?
0.6 m
1.2 m
1.15 m
1.5 m
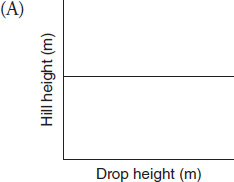
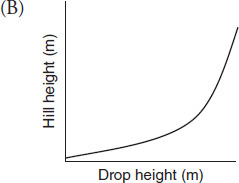
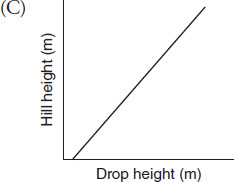
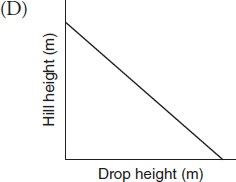
Which of the following graphs best represents the relationship between drop height and hill height in Experiment 1?
The data in Table 5.4 indicate that lengthening the rollercoaster's track:
causes the effects of frictional dissipation to increase.
causes the effects of frictional dissipation to decrease, then increase.
has no effect on the amount of frictional dissipation.
causes the effects of frictional dissipation to decrease.
What was the smallest hill height recorded by the students in Experiment 2?
0.5 m
1.2 m
1.06 m
0.97 m
The students used drop height as the dependent variable in:
Experiment 1 only.
Experiment 2 only.
both Experiments 1 and 2.
neither Experiment 1 nor 2.
If the students were to carry out a third experiment to study the relationship between marble mass and hill height, how would the data table for this new experiment compare to Table 5.3?
They would need to add an extra column between drop height and hill height for marble mass.
They would need to replace the hill height column with a column for marble mass.
They would need to add extra rows to the bottom of the table for additional trials.
They would need to replace the horizontal distance column with a column for marble mass.
Based on the data for the two experiments, at which point in Figure 5.1 does the marble have the greatest gravitational potential energy?
Point A
Between points A and B
Point C
Point B
Which of the following is a similarity between Experiments 1 and 2?
Both experiments began with an initial drop height of 0.6 m.
The effect of the independent variable was studied by measuring hill height.
Horizontal distance traveled was held constant in both experiments.
The initial gravitational potential energy increased with each trial.
Which of the following energy transformations is not demonstrated by the marble rollercoaster in either Experiment 1 or Experiment 2?
Mechanical energy to thermal energy
Mechanical energy to sound
Mechanical energy to chemical energy
Potential energy to kinetic energy
In Experiment 2, a fourth trial using a horizontal distance of 1.75 m would most likely result in a hill height:
greater than the hill height recorded in Trial 2.
less than the hill height recorded in Trial 3.
close to the hill height recorded in Trial 1.
between the hill heights recorded in Trials 2 and 3.
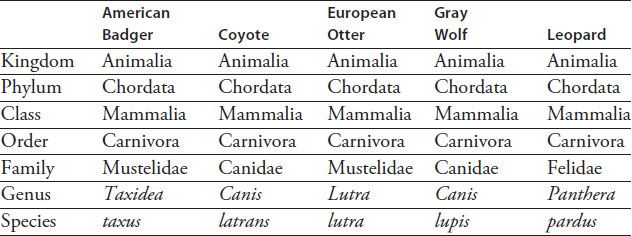
The scientific classification of organisms provides information about the relative level of relatedness between species. Biologists use a hierarchical grouping system to classify organisms into various taxa (groups) based on shared physiological, developmental, and genetic characteristics. Table 5.5 identifies the scientific classification of five common species.
TABLE 5.5 Taxonomic Classification
Biologists use a phylogenetic tree to illustrate the evolutionary history of related species. In a typical tree, currently living species called extant taxa are listed along the right. Moving to the left, the point at which two or more extant taxa meet is called a node. A node indicates an ancestral taxon, or a common ancestor shared by the extant taxa.
Horizontal line length in a phylogenetic tree indicates relative divergence time, an estimation of how long ago the extant taxa are thought to have diverged into separate species. Figure 5.6 shows a phylogenetic tree of the species listed in Table 5.5.
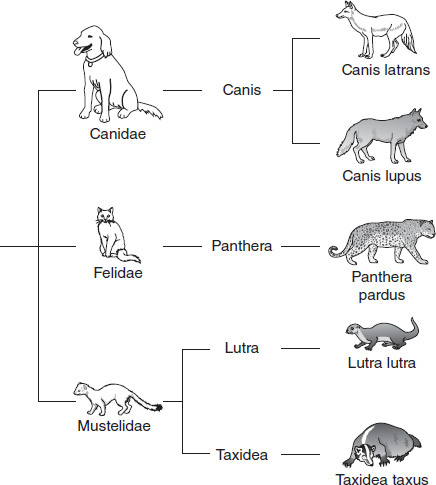
Figure 5.6
The phylogenetic tree in Figure 5.6 identifies evolutionary relationships between which type of organisms?
Mammals
Arthropods
Invertebrates
Amphibians
To which family does Panthera pardus belong?
Mustelidae
Canidae
Felidae
Carnivora
All organisms in Table 5.5 are members of the same:
genus.
order.
species.
family.
Canis latrans is the scientific name of which organism?
American badger
Gray wolf
Leopard
Coyote
According to Figure 5.6, the European otter is most closely related to which species?
According to Figure 5.6, how many common ancestors does Panthera pardus share with Taxidea taxus?
Three
One
Two
Four
According to Figure 5.6, which pair of species have the most recent divergence time?
Based on the information in the passage and Figure 5.6, Taxidea taxus would be considered:
an extant taxon.
a node.
an ancestral taxon.
an order.
Which of the following inferences can be made about the seven-level classification system used in Table 5.5?
Organisms classified in the same kingdom are classified in the same phylum.
Organisms within the same class share a common kingdom and phylum.
Organisms that share a common order cannot be classified in the same family.
Organisms within the same family must share a common genus and species.
The scientific classification of the lynx is shown in Table 5.6. With which species would the lynx share the most recent ancestor?
TABLE 5.6 Lynx Classification
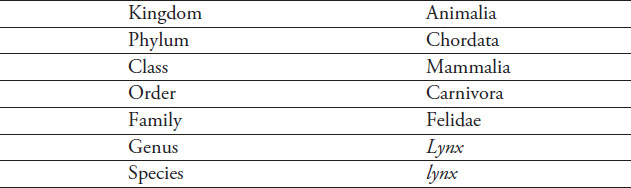
How many taxonomic levels does the lynx have in common with the gray wolf ?
One
None
Two
Four
Based on the information in Table 5.5, it can be predicted that the common ancestor shared by all five species belonged to which taxon?
Mustelidae
Carnivora
Canidae
Felidae
A clade is the taxonomic term for a grouping composed of all the descendants of a single ancestral taxon. According to Figure 5.6, which of the following groupings would not constitute a clade?
The wolverine (Gulo gulo) belongs to the family Mustelidae. Which of the following assumptions can be made about the wolverine?
It is most closely related to the American badger.
It shares the most genetic similarity with the European otter.
It belongs to the same family as the gray wolf.
It belongs to the same order as the coyote.
Which of the following statements is best supported by the information in Figure 5.6?
The Canidae taxon diverged from the Mustelidae taxon more recently than from the Felidae taxon.
Canidae, Mustelidae, and Felidae all diverged into separate taxa at the same time.
The Mustelidae taxon diverged from the Felidae taxon more recently than from the Canidae taxon.
The Felidae taxon first diverged from the Canidae taxon and then from the Mustelidae taxon.