ACT Science Practice Test 16
Bộ sưu tập: Tuyển Tập Bộ Đề Thi Đại Học Hoa Kỳ (ACT) - Có Đáp Án Chi Tiết
Số câu hỏi: 30 câuSố mã đề: 1 đềThời gian: 1 giờ
Agarose gel electrophoresis is a technique in which an electric field is used to separate fragments of DNA by size. Figure 3.2 illustrates a common setup of an electrophoresis apparatus. A square of agarose gel is prepared and placed in a tray of buffer solution. DNA in solution is loaded into small slits (wells) in the top of the gel. A solution of DNA fragments of known length, called a DNA ladder, is loaded in the first well. DNA samples to be studied are loaded in the remaining wells, and an electric current is applied to the apparatus. Since DNA is negatively charged, the DNA molecules in the wells travel toward the opposite, positive end of the gel. Smaller DNA fragments are able to move through the gel more easily and thus move faster than longer fragments. This causes the fragments to separate according to size as the procedure runs. Comparison to the DNA ladder provides an estimate of the separated fragments' sizes.
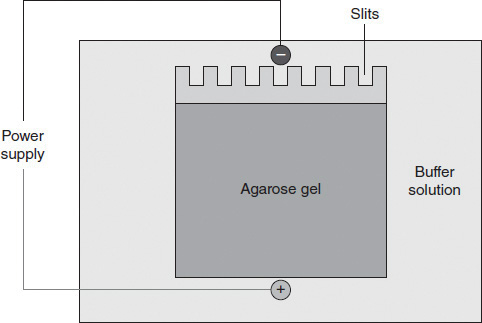
Figure 3.2
In addition to fragment size, several factors can affect the rate of migration of DNA fragments through the agarose gel. Table 3.4 provides a summary of the effects of agarose gel concentration and voltage of the electric current.
TABLE 3.4 Factors Affecting Fragment Migration
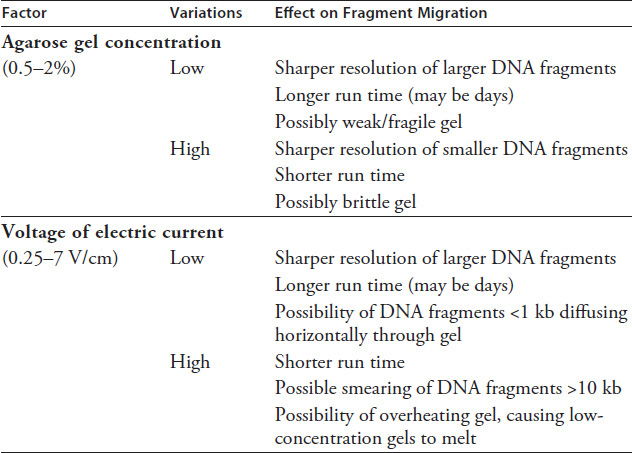
Table 3.5 identifies the agarose gel concentration needed for optimum resolution of DNA fragments within various size ranges.
TABLE 3.5 Agarose Concentrations
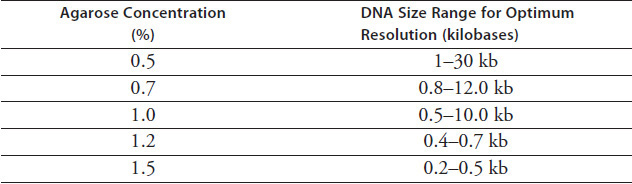
Source: http://www.idtdna.com/pages/decoded/decoded-articles/pipet-tips/decoded/2011/06/17/running-agarose-and-polyacrylamide-gels.
One application of the gel electrophoresis technique is to identify the alleles an individual carries for a particular gene. Although there may be multiple possible alleles (versions) for a specific gene, each individual carries exactly two copies. When subjected to electrophoresis, each allele separates out into a distinct band, allowing that individual's pair of alleles to be identified. A single darker band indicates two copies of the same allele.
Figure 3.3 shows electrophoresis results for a gene with three possible alleles. Allele 2 is known to contain extra bases as compared to Allele 1. Allele 3 is known to be missing bases as compared to Allele 1. DNA samples from 16 different individuals are loaded in Lanes A through P. The sizes of the known fragments in the DNA ladder are listed along the left.
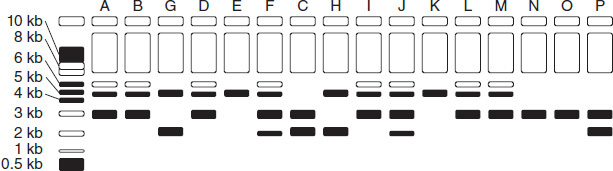
Figure 3.3
In a standard gel electrophoresis procedure, the first well is generally reserved for:
a DNA ladder.
the buffer solution.
smaller DNA fragments.
the DNA sample of greatest interest.
Applying an electric current to the electrophoresis apparatus causes the DNA fragments to travel:
toward the wells.
toward the cathode.
away from the anode.
away from the cathode.
According to the passage, the role of a DNA ladder is to:
propel the DNA fragments through the agarose gel.
provide an approximation of a DNA fragment's size.
identify the base sequence in a DNA fragment.
determine the total number of bases in a DNA fragment.
Which of the following would be a disadvantage of running a gel electrophoresis at a voltage of 6 V/cm?
Poor resolution of large DNA fragments
A short total run time for the procedure
A total run time of more than one day
Brittleness of the agarose gel
According to Table 3.5, as the concentration of agarose increases, the range of DNA fragment sizes that can be resolved:
expands.
is constant.
shrinks.
expands, then shrinks.
Which combination of factors would provide the best results for DNA fragments of 0.5-0.7 kb?
0.7% agarose and 0.5 V/cm
1.0% agarose and 0.5 V/cm
1.2% agarose and 5 V/cm
1.5% agarose and 5 V/cm
When observing electrophoresis results, the largest DNA fragments will appear:
closest to the cathode.
closest to the anode.
as the largest bands.
as the smallest bands.
Based on the information in the passage, Allele 2 traveled through the agarose gel faster than:
Allele 1 but slower than Allele 3.
neither Allele 1 nor Allele 3.
Allele 3 but at the same rate as Allele 1.
both Alleles 1 and 3.
According to the passage, a single darker band, as seen in Lane E, most likely indicates an:
error during the electrophoresis process.
error when collecting the DNA sample.
individual missing an allele due to mutation.
individual with two copies of the same allele.
What is the approximate size of Allele 1?
3.0 kb
1.0 kb
8.0 kb
0.5 kb
What is the most common allele combination represented in the DNA samples shown in Figure 3.3?
Two copies of Allele 2
Allele 1 and Allele 2
Two copies of Allele 1
Allele 1 and Allele 3
Which of the following provides the best explanation for the result shown in Lane J?
Individual J carries Alleles 1 and 3.
Individual J carries Alleles 2 and 3.
Lane J contains the DNA ladder.
Sample J contains DNA from two individuals.
Which allele combination is not represented in the DNA samples shown in Figure 3.3?
Allele 1 and Allele 3
Allele 1 and Allele 2
Two copies of Allele 3
Allele 2 and Allele 3
Which agarose concentration was most likely used in the electrophoresis in Figure 3.3?
1.50%
2.00%
1.00%
1.20%
Which combination of factors would cause the slowest migration of DNA fragments?
0.5% agarose and 7 V/cm
2.0% agarose and 7 V/cm
2.0% agarose and 0.25 V/cm
0.5% agarose and 0.25 V/cm
A student wanted to test human reaction time to different stimuli to determine the conditions that cause the fastest reaction. The student conducted three experiments to test reaction time.
Experiment 1
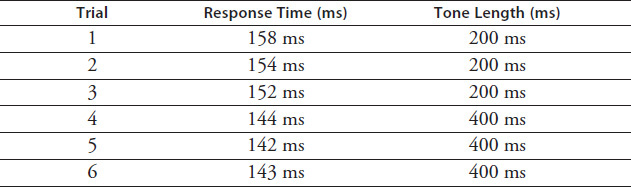
The student used a computer program to record the time between the sounding of a tone and the student pressing the spacebar on the keyboard. This process was repeated 10 times per trial. The program then averaged the 10 response times to produce an average for the trial. The student conducted three trials using a tone length of 200 milliseconds (ms) and three trials with a tone length of 400 ms. Results are shown in Table 3.6.
TABLE 3.6 Experiment 1
Experiment 2
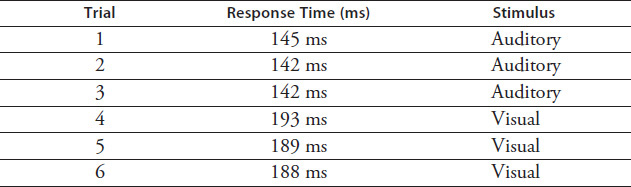
The student then used the same computer program to record the time between the sounding of a tone or the appearance of an image on the screen and the student pressing the spacebar. This process was repeated 10 times per trial, with the computer again averaging the 10 response times for each trial. The student conducted three trials using the tone as the stimulus and three trials using the image. Each stimulus lasted for a duration of 400 ms. Results are shown in Table 3.7.
TABLE 3.7 Experiment 2
Experiment 3
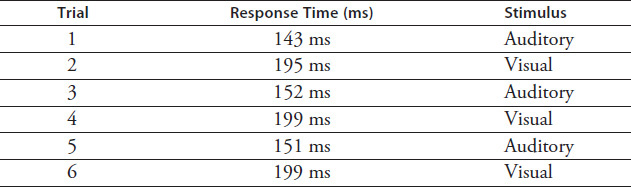
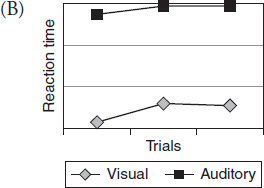
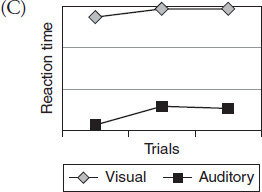
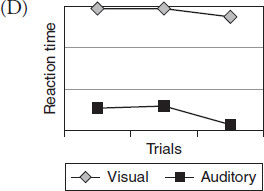
The student repeated the previous experiment but alternated the stimulus (tone versus image) with each trial. Results are shown in Table 3.8.
TABLE 3.8 Experiment 3
In the three experiments, response time is measured as the time between:
exposures to two consecutive stimuli.
exposure to a stimulus and the subsequent response.
the registering of two consecutive responses.
the beginning and end of one trial.
The stimulus in Experiment 1 was the:
sounding of a tone.
appearance of a screen image.
pressing of the spacebar.
use of a computer program.
How do Experiments 2 and 3 differ?
Experiments 2 and 3 used different stimuli to test response times.
The length of exposure to the stimulus was greater in Experiment 2.
Experiment 3 included more trials than Experiment 2.
In Experiment 3, the type of stimulus was alternated with each trial.
Based on the data in Table 3.7, the sense of hearing is:
twice as fast as sight.
more complex than sight.
not as readily testable as sight.
more acute than sight.
A stimulus duration of 400 ms was used during which experiment(s)?
Experiments 2 and 3 only
Experiment 1 only
Experiments 1 and 2 only
Experiments 1, 2, and 3
The fastest reaction time occurred in response to:
an auditory stimulus lasting 200 ms.
an auditory stimulus lasting 400 ms.
a visual stimulus lasting 400 ms.
a visual stimulus lasting 200 ms.
Based on the data in Table 3.6, what is the relationship between reaction time and length of stimulus exposure?
Lengthening the stimulus improves reaction time.
A shorter stimulus produces the fastest reaction time.
Stimulus length has no measurable effect on reaction time.
A longer stimulus produces the slowest reaction time.
Scientists have found that it takes 20-40 ms for a visual signal to reach the brain. Based on the data in Experiments 2 and 3, how long can an auditory signal be expected to take to reach the brain?
25-45 ms
50-55 ms
8-10 ms
20-40 ms
The data in Tables 3.7 and 3.8 best support the conclusion that alternating between two stimuli:
increases the average response time for both stimuli.
improves auditory response time but not visual response time.
decreases the average response time for both stimuli.
improves visual response time but not auditory response time.
Scientists have found that a specific response time range exists for each particular sense. Which of the following would be the range for auditory stimuli?
140-160 ms
180-200 ms
150-170 ms
125-145 ms
How many total responses were recorded during Experiment 2?
10
6
60
30
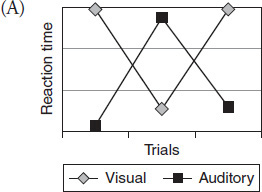
Which graph best represents the data collected during Experiment 3?
The student wants to test how varying the length of exposure to a visual stimulus affects response time. The best way to do this is to repeat:
all three experiments using visual stimuli only.
Experiment 1, replacing the tone with an image.
Experiment 3, using a visual stimulus only.
Experiment 2, using a stimulus duration of 200 ms.
What was the slowest auditory response time recorded during the three experiments?
199 ms
152 ms
142 ms
158 ms
Based on the data from the three experiments, what can be done to improve response time?
Alternate exposure to two different stimuli.
Decrease the duration of each exposure to a stimulus.
Repeat exposure to the same stimulus.
Increase the number of stimuli used at one time.
1 mã đề 22 câu hỏi
1 mã đề 11 câu hỏi
1 mã đề 22 câu hỏi
1 mã đề 13 câu hỏi
1 mã đề 22 câu hỏi
