[TASK 1] IELTS Writing Sample Pack 1 - Pie Chart
Bộ sưu tập: IELTS
Số câu hỏi: 6 câuSố mã đề: 1 đềThời gian: 1 giờ
219,161 lượt xem 16,857 lượt làm bài
Bạn chưa làm đề thi này!
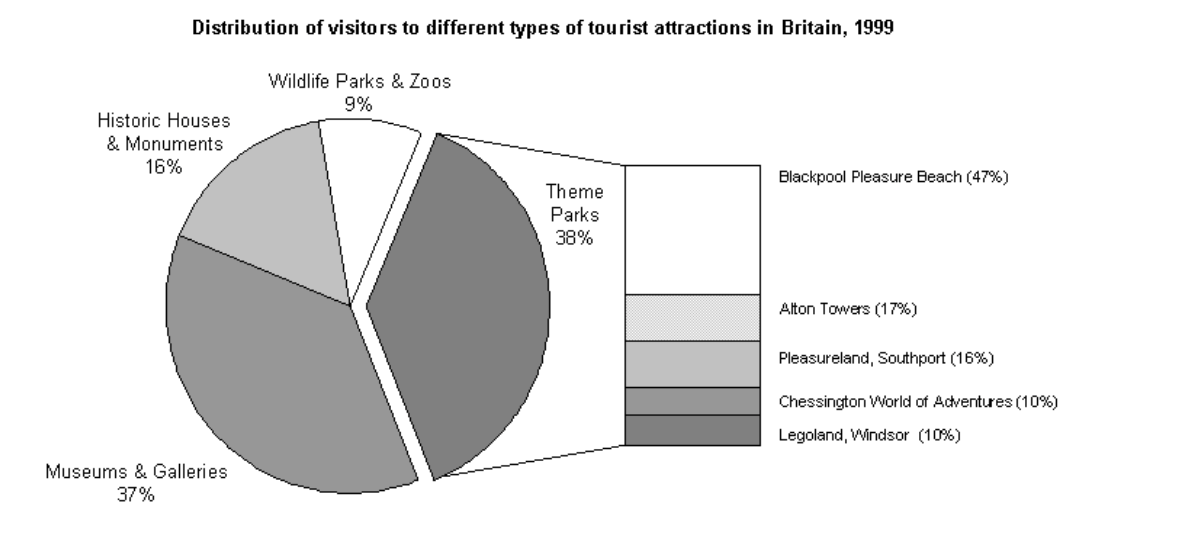
The chart below shows the results of a survey of people who visited four types of tourist attraction in Britain in the year 1999.
Summarise the information by selecting and reporting the main features, and make comparisons where relevant.
The charts below show the results of a questionnaire that asked visitors to the Parkway Hotel how they rated the hotel's customer service. The same questionnaire was given to 100 guests in the years 2005 and 2010.
Summarise the information by selecting and reporting the main features, and make comparisons where relevant.

The pie charts below compare water usage in San Diego, California and the rest of the world.
Summarise the information by selecting and reporting the main features, and make comparisons where relevant.

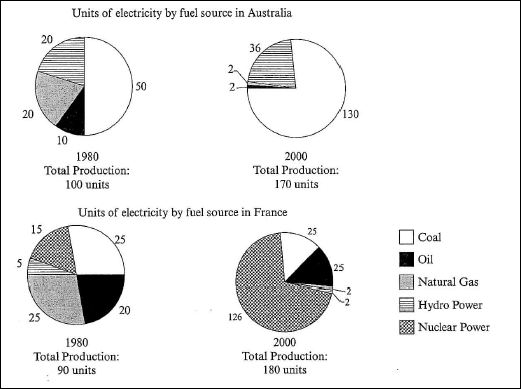
The pie charts below show units of electricity production by fuel source in Australia and France in 1980 and 2000.
Summarise the information by selecting and reporting the main features, and make comparisons where relevant.
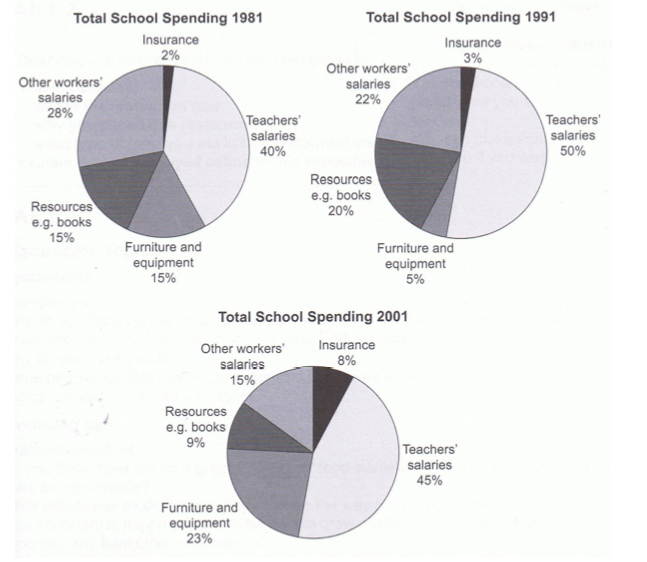
The three pie charts below show the changes in annual spending by a particular UK school in 1981, 1991 and 2001.
Summarise the information by selecting and reporting the main features, and make comparisons where relevant.
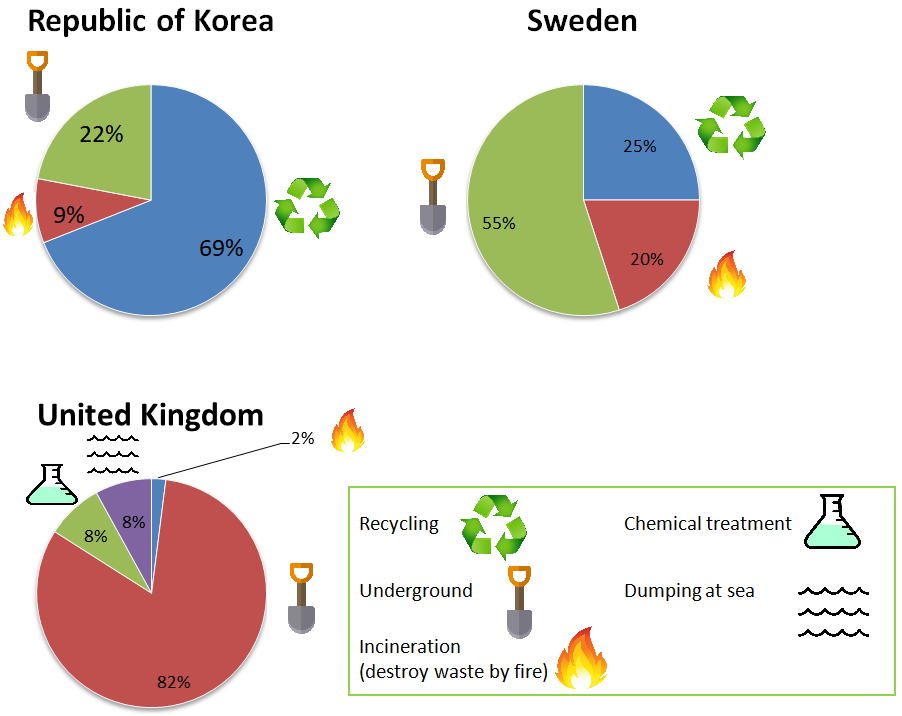
The pie charts below show how dangerous waste products are dealt with in three countries.
Summarise the information by selecting and reporting the main features, and make comparisons where relevant.
1,342 xem
1 mã đề 16 câu hỏi
1 mã đề 13 câu hỏi
1 mã đề 15 câu hỏi
1 mã đề 16 câu hỏi
1 mã đề 7 câu hỏi